
BLUE TECH RADARTechnologies that are transforming the sea.
The observatory showing, in numbers, where fishing technology needs to enter
Santa Catarina landed 197.8 thousand tonnes of fish in 2025 and has, in the Sindipi Observatory, something rare in the sector: open data by municipality, species and fishing gear. That detail is where innovation finds an address.
August 2026
Anyone working in fishing in Brazil knows the complaint: there is no data. National statistics are irregular, arrive late and rarely reach the level at which decisions are actually made.
Santa Catarina solved that its own way. The Observatory run by Sindipi, the union of shipowners and fishing industries of Itajaí and region, publishes the state’s fishing production in an open dashboard, with data from Lema, Univali’s applied marine studies laboratory, and support from Sebrae.
It is not an annual PDF report. It is a dashboard that updates, filters by year, month and type of fishing, and breaks production down by municipality, species and fishing gear.
That last cut is what matters to anyone developing technology, and we will get there.
The size of what is at stake
Landed production in Santa Catarina went from 131.5 thousand tonnes in 2022 to 197.8 thousand tonnes in 2025. That is 50.4% growth in three years.
In 2025, industrial fishing accounted for 122.3 thousand tonnes and artisanal fishing for 75.5 thousand. Two very different chains living on the same coast, with technological needs that look nothing alike.
The geographic concentration also stands out. Itajaí and Navegantes, neighbours separated by the river, alone account for nearly 60% of everything landed in the state between 2022 and 2025.
For anyone selling equipment, that means the whole market fits within a radius of a few kilometres.
The technology is in the gear
The fishing gear table is the most revealing of all, and it is the one almost nobody looks at.
Gear is the catching equipment. Purse seine, gillnets, trawls, longlines, pole and live bait. Each line of that table is a different technology, with a different technical problem and its own supplier market.
The purse seine, responsible for 259.5 thousand tonnes in the period, is the sardine method. It depends on acoustic detection, scanning sonar, net handling and fast refrigeration on board, because sardines lose value within hours.
Gillnets, at 174.5 thousand tonnes, are the field where selectivity and bycatch are most discussed. That is where acoustic deterrent devices, net marking, materials that degrade when a net is lost and sensors reporting when it is full all come in.
Trawling methods together exceed 100 thousand tonnes. It is the fishery consuming the most fuel per kilo caught, and the one that benefits most from door optimisation, net geometry and selective grids.
None of these solutions is science fiction. All of them exist and are installed in fleets in other countries. What is missing is the meeting between whoever supplies and whoever operates.
Why an observatory changes the game
There is a practical difference between knowing that fishing matters and knowing how many tonnes of seabob shrimp come out per year, with which gear and from which municipality.
The first piece of information produces a speech. The second produces an investment decision.
An onboard equipment manufacturer can size a market. A shipyard can design a vessel for the right fishery. A traceability system developer knows how many boats it needs to serve. A public agency can discuss management with a number instead of an impression.
And the sector can defend itself with its own data when the debate on quotas and closed seasons arrives.
It is also worth noting who did it. It was not commissioned from an outside consultancy. It was built by the sector’s own union, with the regional university and institutional support. It is a model other states could copy tomorrow.
What the dashboard does not yet show
No observatory is complete, and pointing out what is missing is part of taking the instrument seriously.
The dashboard works with landed volume. It does not bring value, so there is no way to see whether revenue kept up with growth in tonnage. It also does not show fishing effort, that is, how many boats and how many days at sea were needed to reach that volume.
That is precisely the ratio between production and effort that indicates whether a stock is healthy or whether the fleet is simply working harder to catch the same amount.
None of that takes away from what already exists. The Observatory maintains other dashboards, on the fishing sector, foreign trade by municipality and by state, the labour market and the economic outlook, and combining them covers part of those gaps.
Fishing is technology
There is a frozen image of fishing as an artisanal, almost folkloric activity, immune to innovation. The gear table disproves that at a glance.
A modern purse seiner is a detection platform, with sonar, echo sounder, net sensors, positioning, satellite communication, power generation and a cold chain on board. It is closer to a research vessel than to the picture most people have in mind.
Fishing and aquaculture are among the axes of Blue Nautical Hub Brasil for that reason. Marine electronics, refrigeration, propulsion, net materials, crew safety, traceability and certification are the same subjects appearing in the other axes, applied to a fleet that works all year round.
And the Hub takes place in Santa Catarina, a few kilometres from Itajaí and Navegantes, which is where that fleet is.
Open data is infrastructure
There is a broader lesson in this observatory, and it applies to the whole Ocean Economy.
Technology does not enter a sector just because it is good. It enters when somebody can calculate a return. And you cannot calculate a return without data.
By publishing how much is caught, where, of what and with which equipment, Sindipi is not only being accountable. It is building the information infrastructure that lets a supplier decide to invest in fishing in Santa Catarina.
It is cheap, it is unglamorous and it may be one of the most useful things a sector association can do.
Blue Tech | Santa Catarina fishing in numbers
Landed production in 2025: 197,841.69 tonnes, of which 122,345.90 industrial and 75,495.79 artisanal. Evolution: 131,522 tonnes in 2022, 146,100 in 2023, 193,700 in 2024 and 197,842 in 2025, up 50.4% over the period. Leading municipalities in the 2022 to 2025 total: Itajaí with 277,774 tonnes and Navegantes with 114,575. Leading species: Brazilian sardinella, at 196,533 tonnes. Leading gear: purse seine, at 259,503 tonnes. Source: Sindipi Observatory, with Lema/Univali data updated on 16 August 2026 and support from Sebrae.
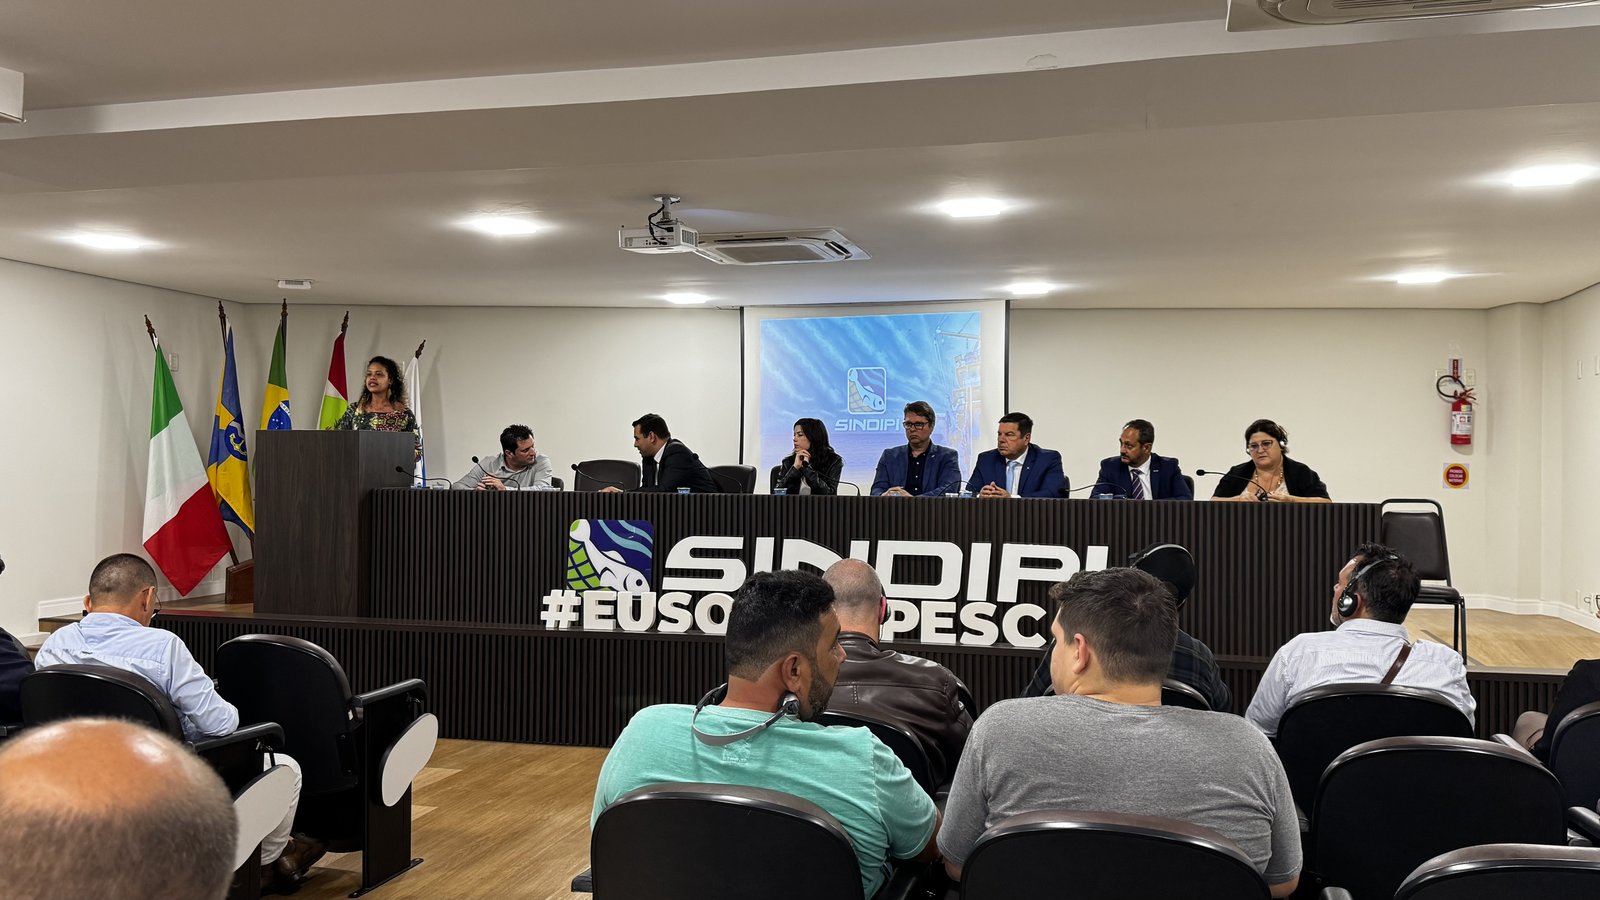
Blue Nautical Hub Brasil report, based on the public dashboards of the Sindipi Observatory. Photo: Mundo Mar.
Santa Catarina fishing production, by year
| Year | Tonnes |
|---|---|
| 2022 | 131.522 |
| 2023 | 146.100 |
| 2024 | 193.700 |
| 2025 | 197.842 |
Growth of 50.4% between 2022 and 2025.
2025 by type of fishing
| Type | Tonnes |
|---|---|
| Industrial fishing | 122.345,90 |
| Artisanal fishing | 75.495,79 |
| Total | 197.841,69 |
Municipalities landing the most
| Municipality | Tonnes |
|---|---|
| Itajaí | 277.774 |
| Navegantes | 114.575 |
| Laguna | 58.682 |
| Florianópolis | 40.313 |
| Biguaçu | 16.715 |
| Passo de Torres | 15.844 |
| Bombinhas | 14.515 |
| Governador Celso Ramos | 12.783 |
| Balneário Barra do Sul | 12.306 |
| Balneário Camboriú | 11.452 |
| Penha | 11.379 |
Sum for the 2022 to 2025 period.
Most caught species
| Species | Tonnes |
|---|---|
| Brazilian sardinella | 196.533 |
| Whitemouth croaker | 80.937 |
| Skipjack tuna | 69.042 |
| Mullet | 36.261 |
| Seabob shrimp | 29.553 |
| Bluefish | 24.768 |
| Scaled sardine | 20.433 |
| Swimming crab | 16.699 |
| Bigeye scad | 12.293 |
| Atlantic anchoveta | 9.122 |
Sum for the 2022 to 2025 period.
Production by fishing gear
| Gear | Tonnes |
|---|---|
| Purse seine | 259.503 |
| Gillnets | 174.540 |
| Pole and live bait | 52.531 |
| Double-rig trawl | 50.253 |
| Pair trawl | 36.700 |
| Various lines | 24.478 |
| Aviãozinho trawl | 12.485 |
| Surface longline | 11.696 |
| Beach seine | 8.052 |
| Ringed gillnet | 7.443 |
| Single trawl | 6.802 |
Sum for the 2022 to 2025 period. Source for all tables: Sindipi Observatory, with Lema/Univali data updated on 16 August 2026.